
Note
Go to the end to download the full example code.
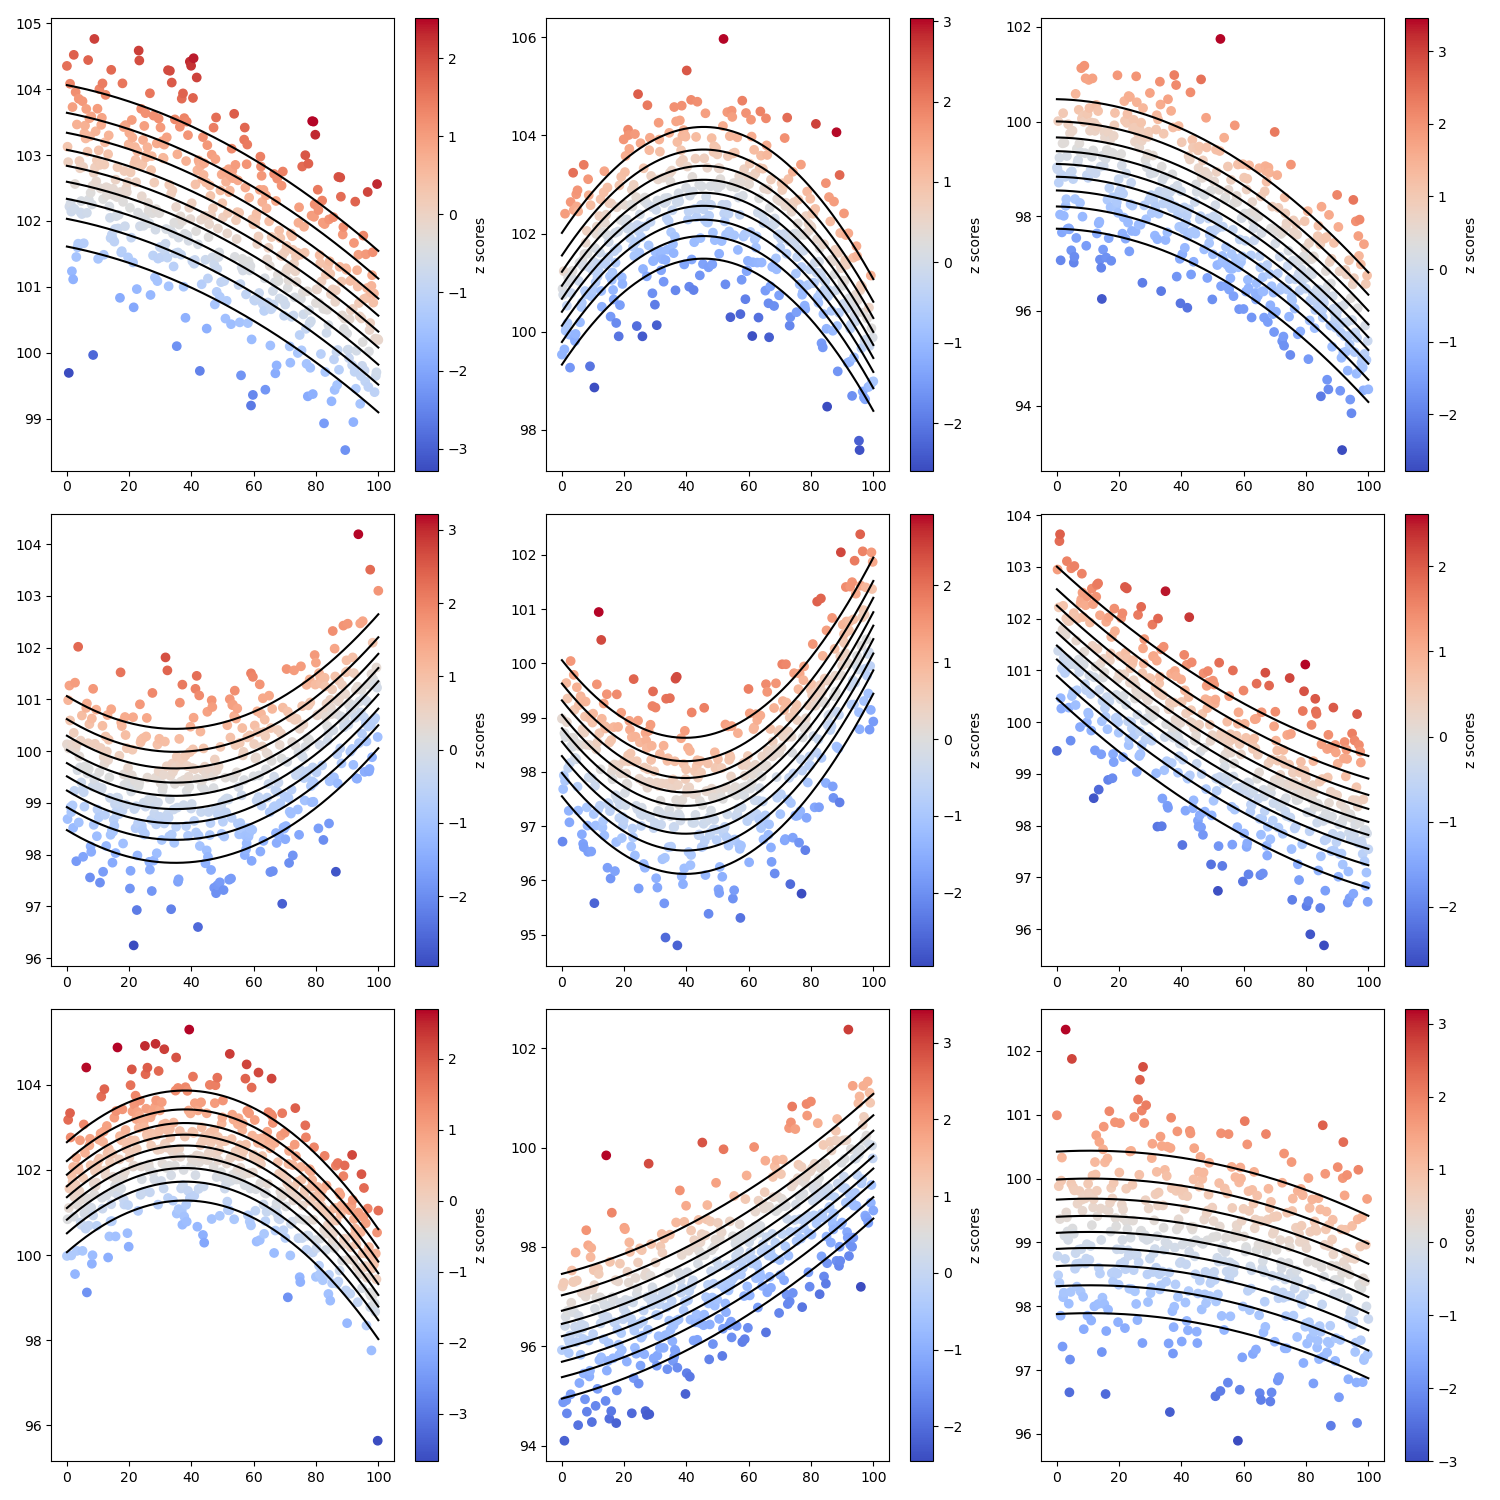
Fitting Multiple Normative Models#
This script demonstrates the process of fitting multiple normative models to data and visualizing the results.
We first generate synthetic data for multiple variables across a range of ages. Then, we fit a MassUnivNormodOLS model to the data, which is capable of handling multiple variables simultaneously. Finally, we visualize the results, including centiles and z-scores, for each variable.
Imports#
import numpy as np
import matplotlib.pyplot as plt
from sknormod import MassUnivNormodOLS
from sknormod.datasets import make_gaussian
from sknormod.plotting import plot_scatter_with_lines
Generate synthetic data#
We generate synthetic data for multiple variables across a range of ages.
n_subj = 500  # Number of subjects
n_cols = 9    # Number of variables

age = np.linspace(0, 100, n_subj)
X = np.column_stack((age, age**2))  # Age and age squared as features
# Generate synthetic Y data for each variable
Y = np.column_stack([make_gaussian(n_subj,
        interpolate_mu = np.random.normal(loc=100, scale=2, size=3))[1]
                     for _ in range(n_cols)])
Fit and get z-scores and centiles#
# Fit MassUnivNormodOLS model
mass_normod = MassUnivNormodOLS()
mass_normod.fit(X, Y)

# Calculate z-scores and centiles
Z = mass_normod.transform_to_z(X, Y)  # Calculate z-scores for each variable
# Calculate centiles for each variable
mass_estimated_centiles = mass_normod.predict_distr_p(X,
                            np.linspace(0.1, 0.9, 9), range(n_cols))
Plotting#
Visualize the results for each variable
fig, axes = plt.subplots(3, 3, figsize=(15, 15))
for i_col, ax in enumerate(axes.flat):
    plt.sca(ax)
    plot_scatter_with_lines(age,
                            Y[:, i_col],
                            lines=mass_estimated_centiles[i_col],
                            c=Z[:, i_col])
plt.tight_layout()
plt.show()
Total running time of the script: (0 minutes 0.461 seconds)